¶ Repeat Scans and Comparing Reports
A repeat vulnerability scan in the RedRays Security Platform writes a new report with its own findings rather than updating the previous one, and the comparison view puts several reports of one landscape side by side by counting findings per severity band in each.
That design decision has one large benefit and one cost, and both are worth understanding before a trend chart is shown to anybody who will act on it.
¶ Why does a new scan not update the old report?
Because a report is a photograph of one moment and rewriting it would destroy the record. Opening an old report reads what was found on the day it was taken, and nothing re-runs. That is what makes a report usable as evidence months later.
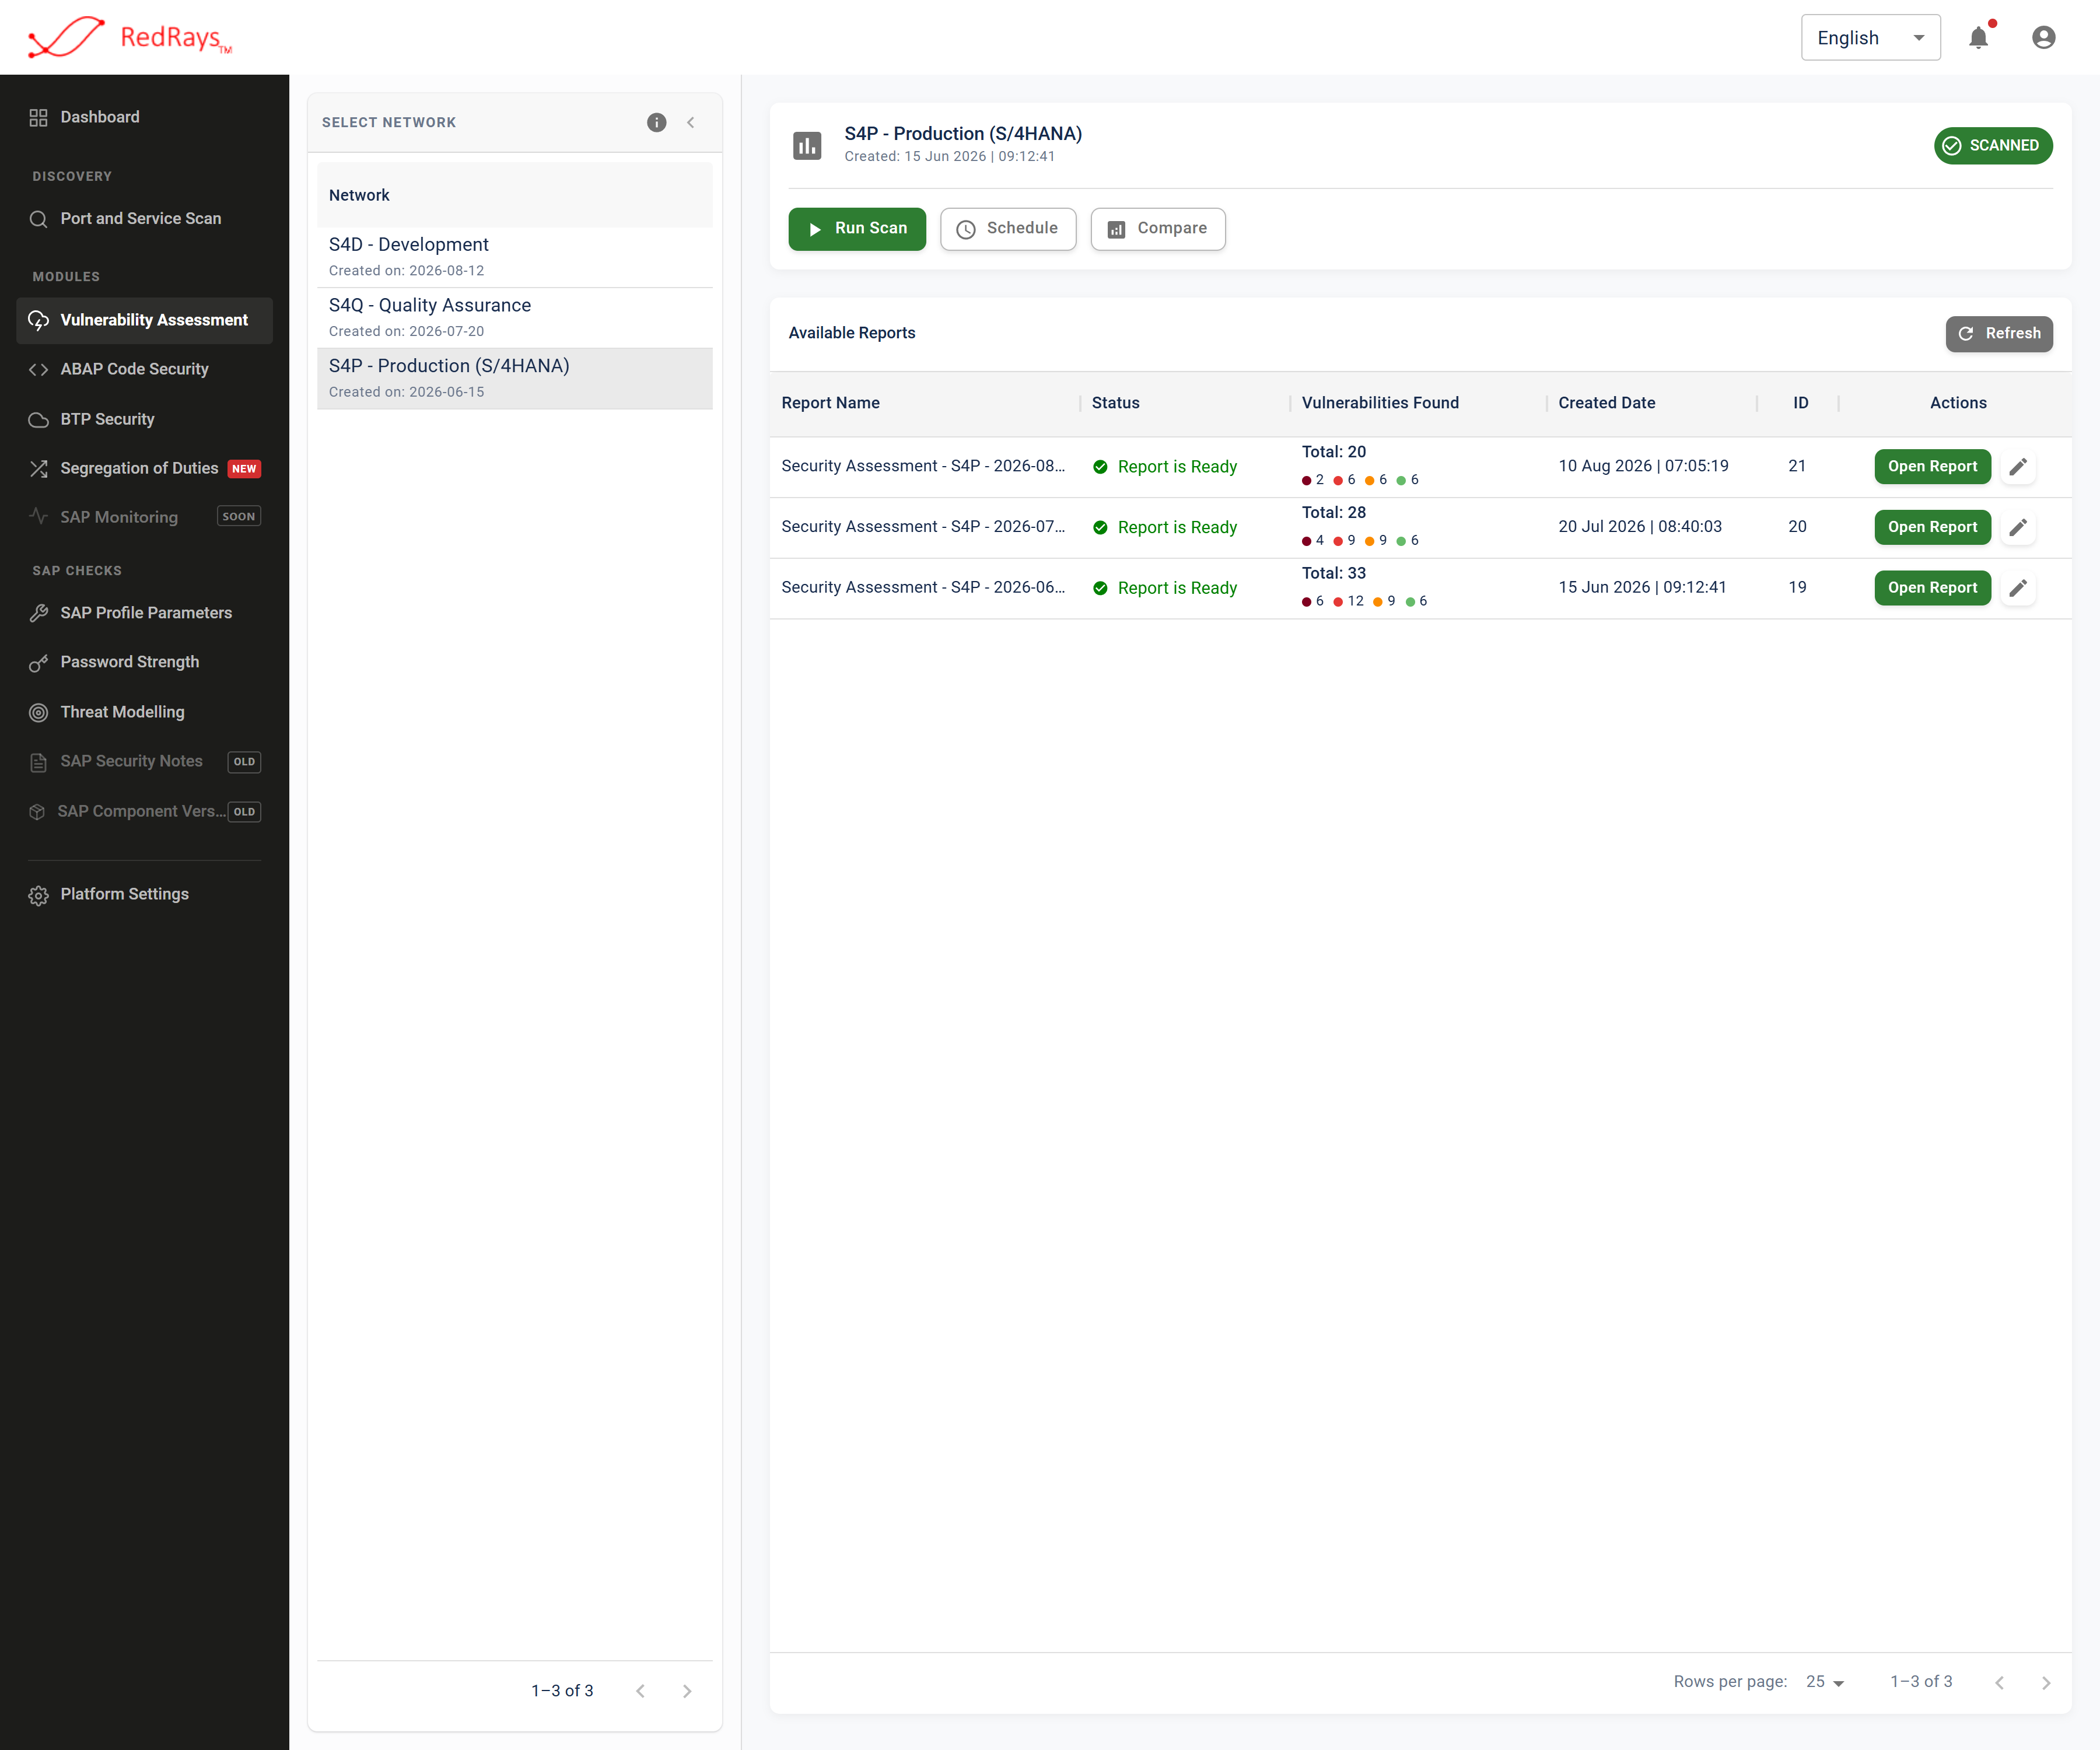
Every scan of a landscape is kept as its own report, so an earlier run stays readable after a later one has been taken.
The cost is that nothing reconciles one scan with the next. No finding is matched to a finding in an earlier report, on any key. No decision is carried forward. If an issue is still present, the next scan raises it again as a new finding, and the finding you marked fixed stays marked fixed on the report where you marked it, for as long as that report exists.
¶ How do you tell whether a landscape improved?
By comparing counts, and by knowing exactly what the counts are made of. Select two or more reports of one landscape and the comparison charts each report's findings by severity band, with summary cards above the chart.
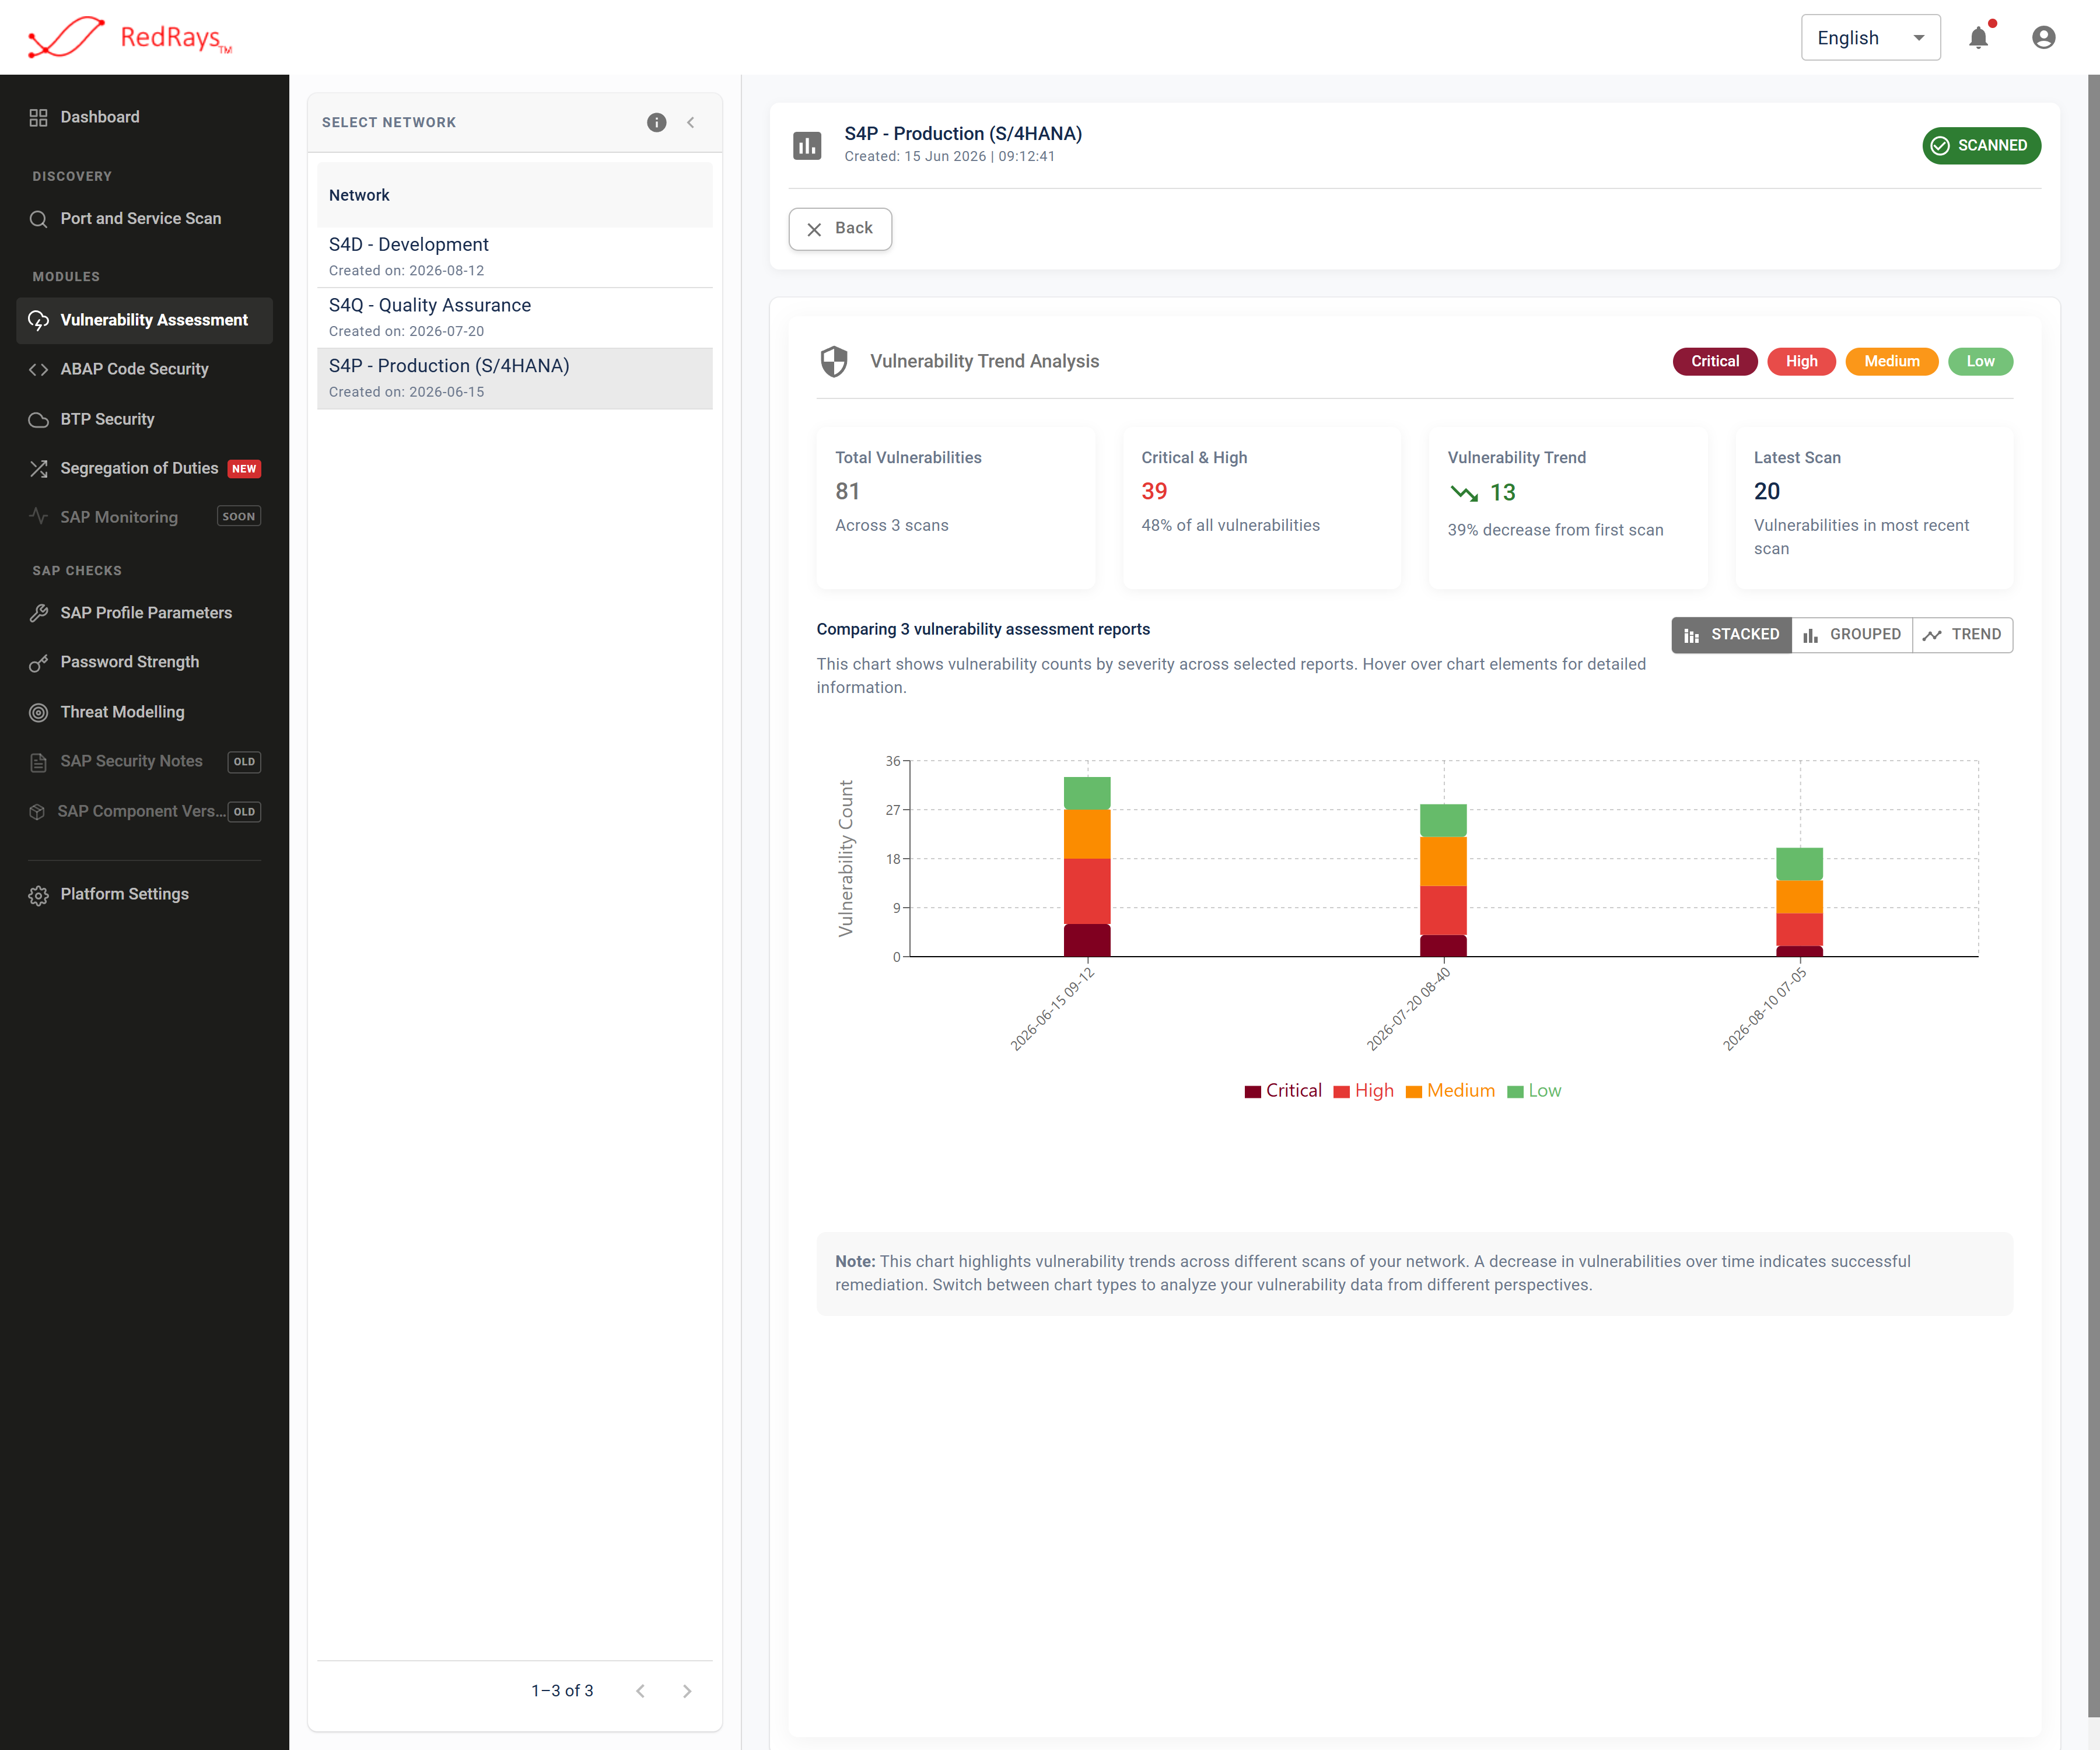
The comparison knows a count per severity band per report and nothing else, which is why it can show a change but never its cause.
| Card | The arithmetic behind it | The trap |
|---|---|---|
| Total across the comparison | The sum of every selected report's finding count | An issue found in June and again in August is counted twice, so a landscape scanned three times can out-total a worse landscape scanned once |
| Critical and high | Those two bands, across the selected reports | Same double counting, on a narrower slice |
| Trend | The newest report's total minus the oldest | It prints a distance and carries direction in the arrow and the colour rather than in a sign |
| Latest scan | The most recent selected report's total | It is one report, not the period |
The chart knows severity counts per report and nothing else. It cannot say what was fixed, what is new, or what has been there the whole time. A count that fell because somebody triaged three findings, or because a host was unreachable on the later scan, draws the same shape as a count that fell because the estate was hardened.
¶ What should you do with that limit rather than around it?
Three habits make repeat scanning honest.
Compare like with like. Two reports are comparable when they were routed by the same inventory and run with the same credentials stored. Record both alongside each scan, per what a clean report does not say.
Track issues, not totals. For remediation, group findings by the issue behind them and by the place they were found. The total on a chart is a count of places measured across scans, and it is the largest of several defensible numbers over the same data.
Verify a fix with the next scan, not with a status. Marking a finding fixed records a decision. The evidence that the service stopped answering is a later report that does not raise it. If the issue is genuinely remediated, it simply does not appear, and an absence is what you will be reading, with the caveats that carries.
¶ How often should a landscape be re-assessed?
Often enough that the report is younger than the change rate of the landscape. A scan can be scheduled to run on a cycle, and the frequencies offered run from daily through weekly, fortnightly, monthly, quarterly, half-yearly and yearly, with a custom interval in whole days. An optional time of day can be set, on the server's clock rather than the reader's.
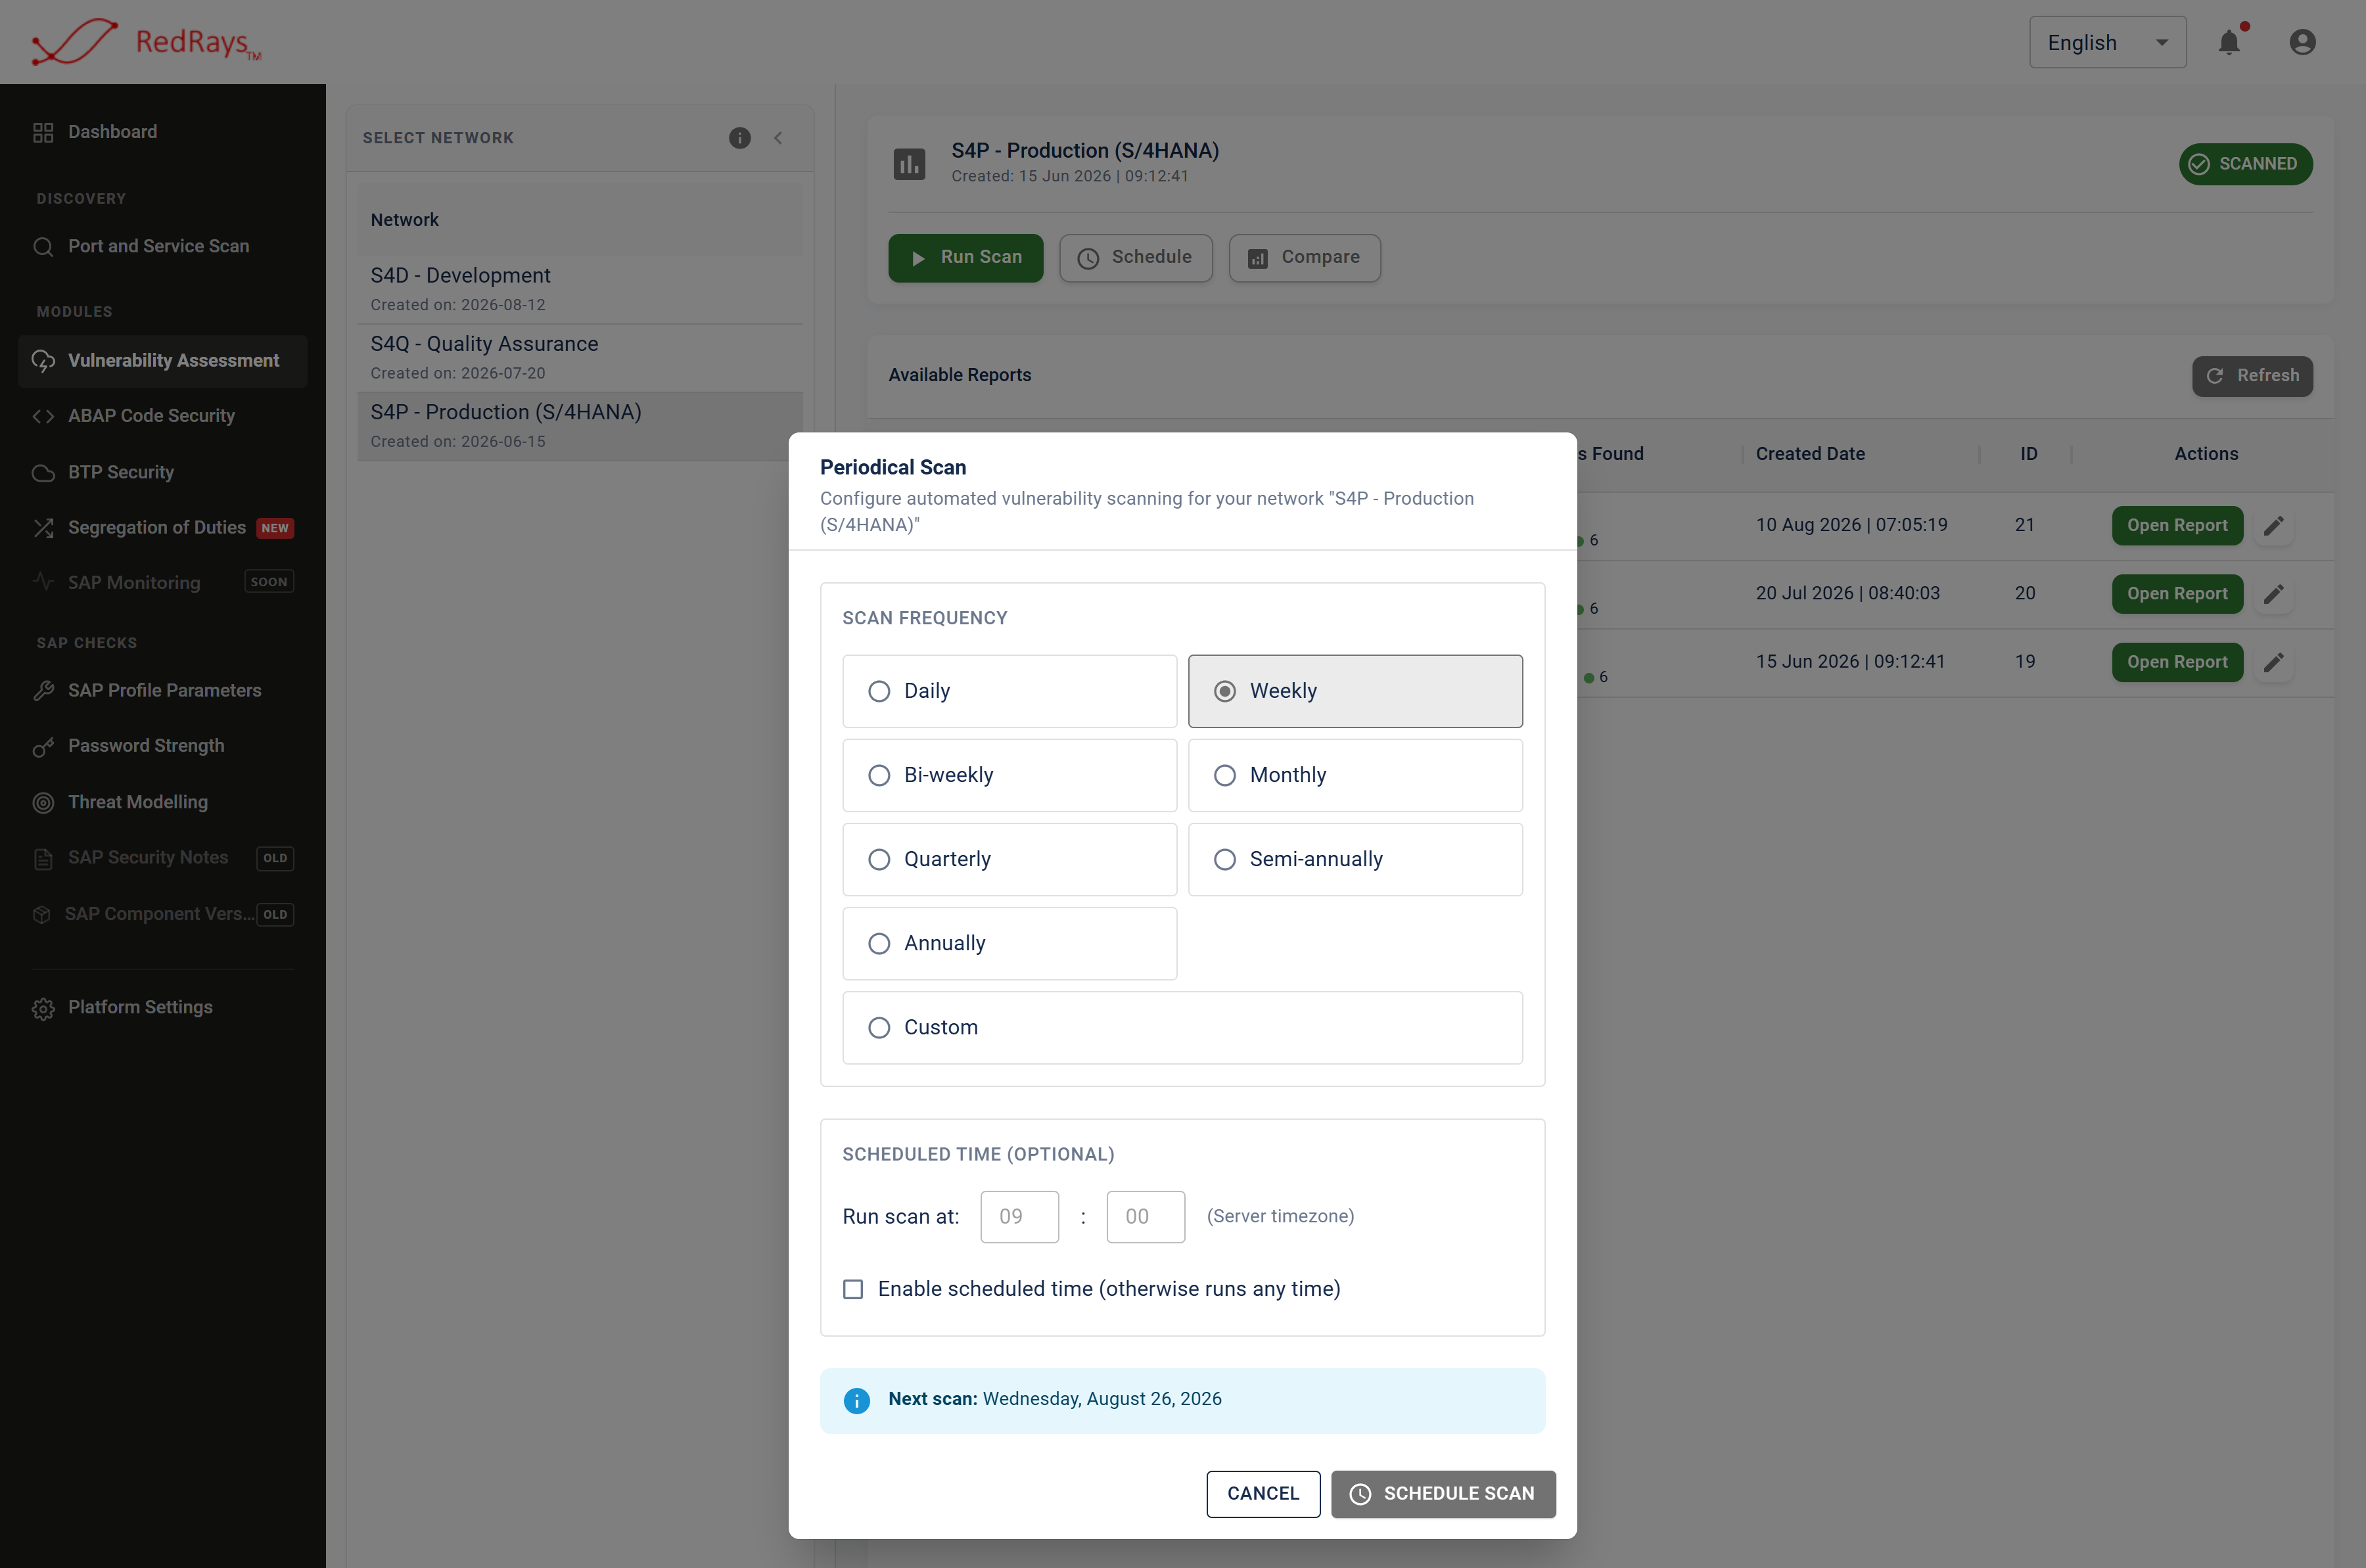
A schedule is a standing authorisation to reach the landscape with nobody present, timed on the server's clock.
A scheduled run reaches the landscape exactly as a manual one does, with nobody present at the moment it happens, so schedule it into a window your operations team knows about. A full run also performs the profile parameter, component version and SAP Security Notes checks over Remote Function Call (RFC) where the licence permits them.
¶ What this does not do
- It does not diff two reports finding by finding. There is no list of new, resolved and unchanged issues.
- It does not carry a decision forward. Triage belongs to the report it was recorded on.
- It does not label the cause of a change. A fall in count is a fall in count.
- It does not compare across landscapes as a like-for-like measure. Two landscapes with different exposure were asked different questions.
- It does not notice that an inventory has gone stale. Re-run the port and service scan when the network changes.
¶ Related pages
- SAP vulnerability assessment, the capability these reports come from
- What a clean report does not say, for what has to be recorded beside each scan
- Published severity against recorded status, for why a decision does not survive into the next report
¶ Frequently asked questions
¶ If I fix something, will the next scan confirm it?
Only by absence. The next scan raises what it finds; it does not report what it stopped finding. Read the pair of reports together, and treat the caveats on absence as part of the answer.
¶ Why does the trend card never show a minus sign?
It prints the size of the change and carries the direction in the arrow, the colour and the wording. A reader looking for a negative number is looking for something the card does not draw.
¶ Can I compare reports from two different landscapes?
The comparison is built for several scans of one landscape. Comparing across landscapes puts unlike question sets on one axis, so read any such chart as two separate measurements drawn together rather than as a like-for-like trend.
¶ Does a scheduled scan notify anybody?
A scan announces itself when it starts. Treat the schedule as a standing authorisation to reach that landscape, and make sure the window is one your operations team has agreed to.