¶ Reading the SAP Landscape Map
The landscape map in the RedRays Security Platform is a directed graph: each node is a system or host that appeared as one end of an RFC destination, and each arrow is one or more destinations that would let somebody on the system at the tail reach the system at the head without a second password.
The picture is built to be read in about ten seconds and then interrogated. What follows is the order that works, and the places where a reader who does not know the construction will draw the wrong conclusion.
¶ What is a node?
A node is one end of at least one qualifying destination, drawn with its system identifier where one is known, its environment type, and the address or hostname it was recorded under. Shape and colour carry the environment type, so production, quality, development, an external host and a routing intermediate are distinguishable at a glance.
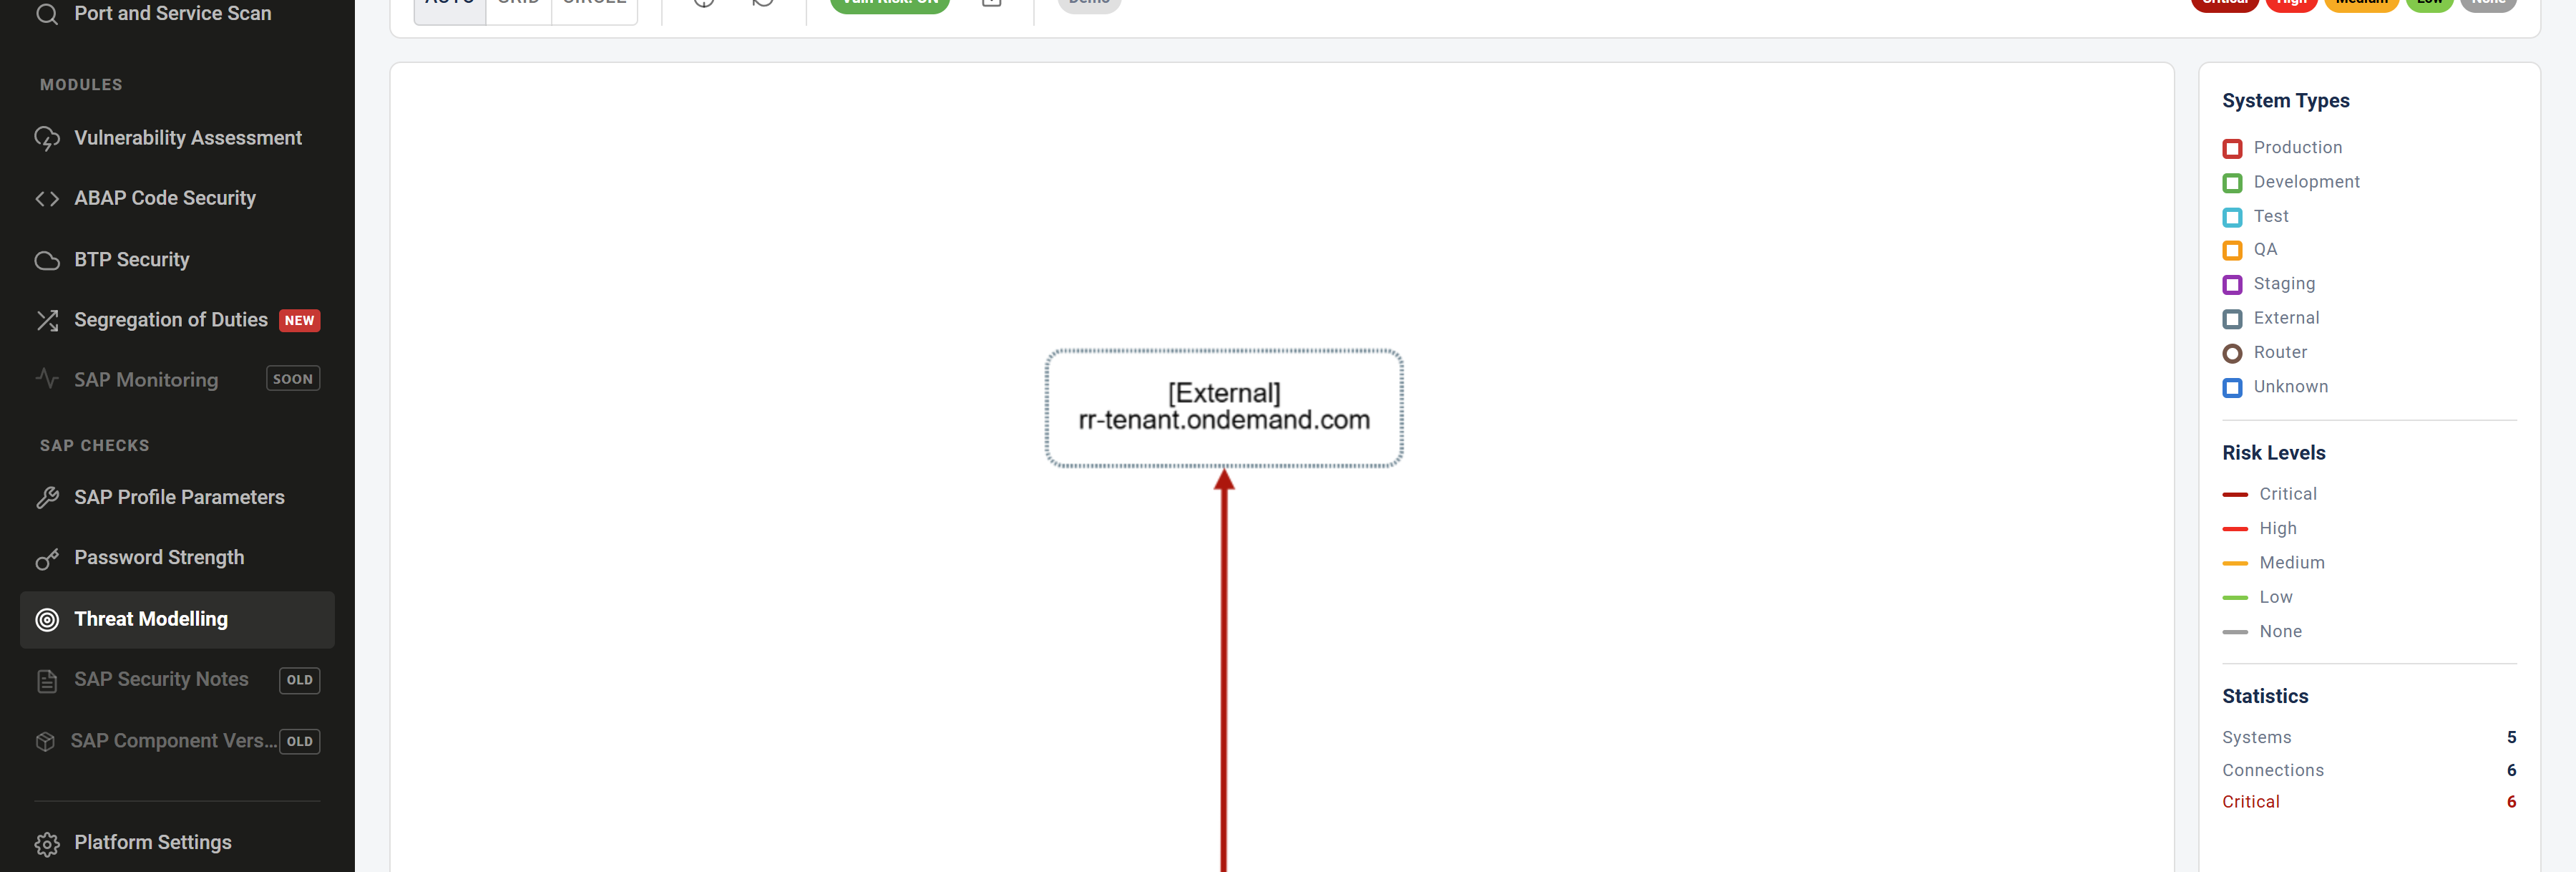
The panel beside the drawing is where a shape and a colour turn back into an environment role, which is what lets the graph be read before anything is clicked.
One caution follows from how the ends are recorded. The far end of a destination is whatever string SAP holds for it, so a machine reached by hostname in one destination and by address in another can appear as two nodes. If two nodes look like the same system, they may be, and the destination configuration is where to check.
¶ What does an arrow mean?
An arrow means a password-free hop exists in that direction, from tail to head. It does not imply anything about the reverse direction: a path back is a separate destination, configured on the other system, and it is drawn as its own arrow when it exists.
Arrows are collapsed to one per pair of systems. Where several qualifying destinations run between the same two systems, the picture shows one line and the per-connection view names each destination behind it.
¶ What does the colour of an arrow tell me?
The colour is a combined severity, and combined is the word to hold onto. It takes into account the environment boundary the path crosses and the security posture already recorded against the system at the tail of the arrow. That means a red arrow can be red because the hop is serious, or because the machine it starts from is carrying unaddressed findings of its own, or both.
The consequence for a reader is worth being blunt about: the colour is a prioritisation aid, not a description of the hop. Open the connection to see which of the two contributed, and read the boundary grade there. A picture read from across a room supports a conversation about where to start and does not support a conclusion about any single path.
¶ What does the per-connection view add?
Selecting a connection gives the source, the target, the transport, the boundary grade where both ends have a known environment type, the severity contributed by the source system's own findings, and the names of the destinations on that pair. Those names are the handles a Basis administrator needs, because they are what identifies the entry to repair or delete.
¶ What can be done with the picture?
| Action | What it is for |
|---|---|
| Layout | Rearranging the same graph. An automatic layout for a landscape with structure, a grid for comparing node counts, a circle for a small landscape where every pair should be visible |
| Fit to view | Bringing a landscape that has grown past the viewport back into frame |
| Toggle the vulnerability contribution | Separating the two halves of the arrow colour. With the source system's findings excluded, what remains is the boundary grading, which is the half specific to this analysis |
| Export the picture | Taking the drawing into a report or a slide |
| Re-read from SAP | Replacing the map with the result of a fresh read. See what threat modelling reads from SAP |

Every control that changes the picture sits on one bar, and only the re-read goes back to SAP; the rest rearrange what has already been read.
¶ Limits worth knowing before you present it
- An exported picture carries no provenance. It records the drawing and not the date of the read, the systems covered, or the account that performed it. If the image is going into a report, write those things next to it. A picture six months old and one six minutes old look alike.
- The map is a picture, not a work queue. There is no filtering by severity and no search across a large landscape, so triage is done by reading connections rather than by narrowing the drawing.
- Absence is not evidence. Two systems with no arrow between them either have no qualifying destination or were not both read. The drawing renders those identically, which is why what the landscape map does not claim exists.
¶ Frequently asked questions
¶ Why does one machine appear twice?
Because it was recorded under two different strings, usually a hostname in one destination and an address in another. Both nodes are real observations of the same system, and the destination configuration will confirm it.
¶ Why does a node have no system identifier?
Because the identifier is only known for hosts the platform has separately identified as SAP systems. An external host or a routing intermediate is drawn under the string the destination recorded.
¶ Can I hand this to an auditor as evidence?
Hand it over with the scope written beside it: which systems were read, when, and by which account. The picture on its own is a diagram, and a diagram without its scope invites a conclusion nobody measured.
¶ Where do I start reading?
With arrows that end at production and arrows that leave it. System types and environment boundaries explains why those two are the important ones, and SAP threat modelling and attack paths is the overview of the capability.